Figure M2

Full description
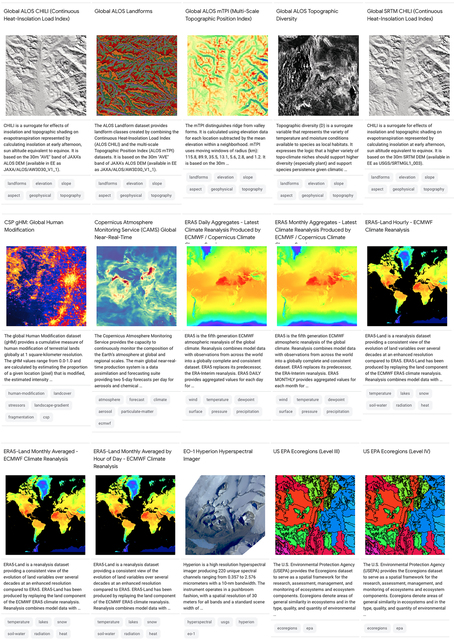
An array (3 x 5) of satellite images that describe different datasets of satellite images. The images show topographic shapes as well as different scales of visualisations of remote sensing data of landform classes, weather variations (top row) as well as examples from Copernicus Atmosphere Monitoring Service and “evolution of land variables” (middle row) to similar images described as “evolution of land variables”, “hyperspectral imager” dataset, to US Environmental Protection Agency “Ecoregions dataset” described as “spatial framework for the research, assessment, management, and monitoring of ecosystems and ecosystem components” (bottom row).
In more detail, the images in thumbnail style from left to right in the first row: “Global ALOS CHILI (Continous Heat-Insolation Load Index) with a greyscale image of a topographical landscape; “Global ALOS Landforms”, with a colourful red, green, blue, orange image of abstract landform/topography type of veins; “Global ALOS mTPI (Multi-scale Topographic Position Index”, with also a vein-like image of topographic variation; “Global ALOS Topographic Diversity”, with greyscale black and white topographic shape that “represents the variety of temperature and moisture conditions”; “Global SRTM CHILI (Continous Heat-Insolation Load Index” with a similar image on the far left of the row of a topographic variation with a tree-like shape.
Second row, from left to right: “CSP gHM: Global Human modification”, with an abstract map with certain areas highlighted in more intensive yellow and red to show “human modification of terrestrial lands”; “Copernicus Atmosphere Monitoring Service (CAMS) Global Near-Real-Time”, with an image below it that shows swirling dynamic shapes that represent the composition of Earth’s atmosphere at different scales; “ERA5 Daily Aggregates—Latest Climate Reanalysis Produced by ECMWF / Copernicus Climate”, with a bright image that shows part of the globe (possibly centering on Africa, and Europe to its North) coded in intensive red at the center, more yellow and then green tones toward south and north of the map image; “ERA5 Monthly Aggregates—Latest Climate Reanalysis Produced by ECMWF / Copernicus Climate”, with same or similar image as previous one; “ERA5-Land Hourly- ECMWF Climate Reanalysis”, with an image below it that shows a map view of part of the planet from the Americas to Greenland, Africa and Europe to part of Russia and Asia, color coded as previous image from blue to red.
Last row, images from left to right: “ERA-5 Land Monthly Averaged-ECMWF Climate Reanalysis”, with an image below it similar or same as the previous row’s last image on the right; “ERA5-Land Monhtly Averaged by Hour of Day—ECMWF Climate Reanalysis”, with an image below that is similar or same as previous two images described; “EO-1 Hyperion Hyperspectral Imager”, with an image below of an abstract surface broken into troughs and ridges”; “US EPA Ecoregions (level III) with an abstract topographical style map with colors from red, green, blue to patch of purple in the left corner; “US EPA Ecoregions (level IV) with similar or same image as to the left.
Comments
to view and add comments.
Annotations
No one has annotated a text with this resource yet.
- typeImage
- created on
- file formatjpg
- file size7 MB